Analytics & Dashboards – OptigoApps
Turn Your Data Into Actionable Insights
Optigo’s Analytics & Dashboards Module brings your jewelry business data to life with real-time visualizations, smart KPIs, and advanced reporting capabilities. From inventory to sales, production to repairs, and customer trends to profitability — everything you need to monitor, measure, and scale your operations is right at your fingertips.
Key Features of Optigo’s Analytics & Dashboards
📈
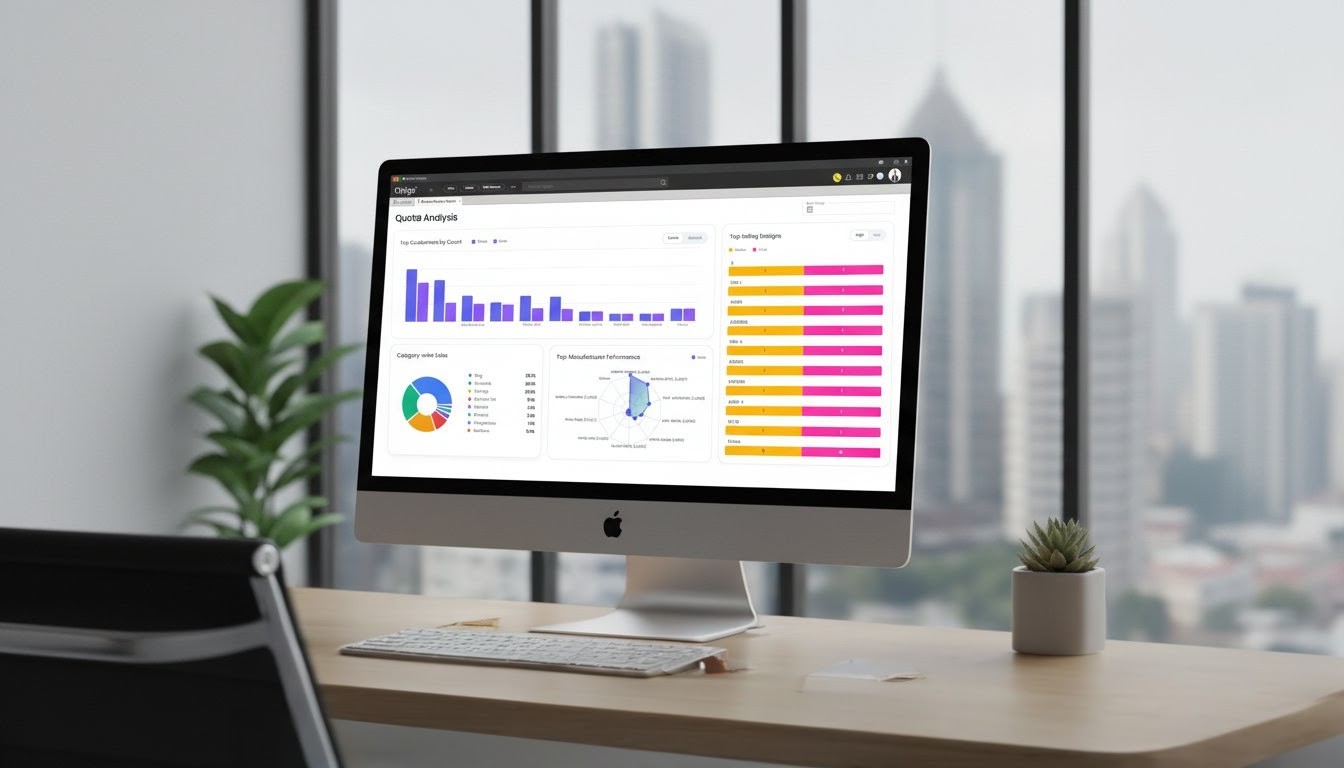
Real-Time Business Dashboards
- Access key performance metrics the moment they happen. Stay in control across branches and departments.
- Live sales, billing & revenue data
- Real-time stock movement and item-wise inventory tracking
- Purchase, production, and job work summaries
- Outstanding payments & collection dashboard
- Approval/Memo return status updates
⚙️
Customizable KPIs & Metrics
- Set your own success parameters based on your business priorities:
- Daily, weekly, monthly targets
- Sales executive-wise tracking
- Branch-wise or showroom-wise performance
- Top-performing items, customers, and vendors
- Loss percentage in production or stock wastage
📊
Advanced Reporting Suite
- Make deep-dive business decisions with structured and export-ready reports.
- Sales & profitability reports by item/category/weight/purity
- Job work and karigar performance analysis
- Inventory aging, reorder levels, and valuation
- Repair TAT (Turnaround Time) analytics
- Accounts receivable/payable reports
- GST, HSN/SAC & compliance-based reports
📤
Visual Graphs & Export Options
- View trends in a glance or share them with stakeholders instantly.
- Bar charts, pie charts, and line graphs for trend analysis
- Export to Excel, PDF, or print-friendly formats
- Schedule reports to email or cloud folders
🏬
Branch-Wise Comparison & Consolidation
- If you manage multiple showrooms or production centers, Optigo lets you consolidate and compare performance across locations:
- Cross-branch inventory balance
- Branch vs branch sales heatmaps
- User-based permissions for secure data visibility
🚨
Alerts & Anomaly Detection
- Stay informed when something goes off track:
- Alerts for negative stock, low reorder levels, high wastage
- Customer-specific credit limit breach notifications
Why Optigo Analytics & Dashboards?
- One-click access to key insights
- Visual and export-friendly formats
- Integrated with all modules: sales, inventory, accounts, production
- No technical knowledge required
- Helps identify gaps, patterns, and new growth opportunities
- Make data your business's competitive edge with Optigo's smart analytics tools.